This article covers Wedge/Triangle Chart Pattern Strategy, involving the trading breakouts of such chart formations as wedges and triangles.
This strategy is perfectly suited to the entry-level traders since it is easy to apply and start gaining profit from Forex trading. Many traders stick to the Wedge/Triangle Breakout Strategy because it is very effective. Try out both the Wedge Pattern Strategy and the Triangle Pattern Strategy in the ForexCup contests on Demo.
Wedges
Wedges are formations that appear very commonly on the charts. The bulk of the work is done in trying to identify these patterns. Once they are detected, they can be traded with the strategy that we shall describe below.
There are two wedge patterns: the rising wedge and the falling wedge. The wedge patterns are made up of converging trend lines, which either slant upwards in the case of the rising wedge, or slope downwards for the falling wedge.
The price action is expected to breakout in the direction opposite that of the wedge. This strategy aims to identify the breakout point, and to set appropriate entries and exit points for trades.
Indicators
Two indicators can be used for this strategy:
- Chart pattern recognition indicator;
- Color-coded MACD histogram.
The chart pattern recognition indicator is used to identify the chart patterns as they occur. Several indicators are available online. Go for the paid ones. Autochartist offers a good version and is sold on a monthly subscription basis.
The color-coded MACD indicator is used to confirm the decision to enter. A blue indicator mark is used to confirm entry for the falling wedge, and a red indicator mark does the same for the rising wedge.
The Breakout
The determination of the breakout is the key for this strategy. Breakout occurs when the price action breaks through a trend line and closes beyond it.
A candle that moves both below the lower trend line and closes below it, forms a rising wedge breakout. The candle must move above the upper trend line of a falling wedge and close above it for a breakout to occur.
If price action merely breaches the trend line and heads back to where it came from, it cannot be deemed a breakout.
On many occasions, you can allow the next candle to attempt to pull back below the upper trend line in a falling wedge, or above the lower trend line in a rising wedge. The broken trend lines usually resist this movement, which allows trading closer to the trend line for more precise entries, leading to a lower drawdown.
Short Entry
The short trade is reserved for the rising wedge. Here, the trend lines slant upwards. The lower trend line shows a greater degree of slant than the upper trend line. The aim is to catch the breakout when the MACD histogram is red and trade accordingly. You should allow the price to pull back to the broken trend line before entering the trade.
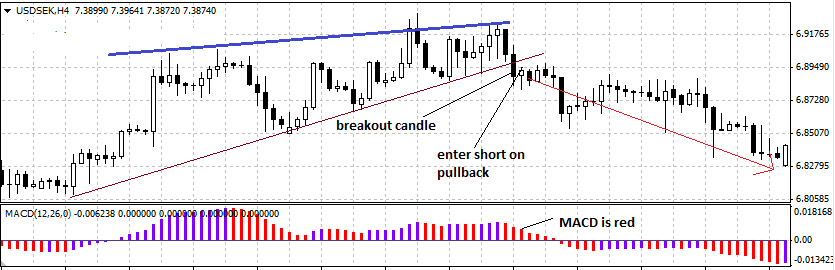
Short entry setup on rising wedge
We can see that the price action broke below the lower trend line, and then the price pulled back to the lower trend line thus forming a pin bar. The short entry would have yielded at least 670 pips on this 4-hour chart of the USD/SEK currency pair.
The stop loss is set a few pips above the broken trend line. Take Profit is set at an appropriate level that should be at least 3 times the stop loss.
Long Trade
The long trade is used with the falling wedge. Here trend lines that slope downwards identify the wedge. The upper trend line forms a greater slope angle than the lower trend line.
The key is to watch for the breakout candle, then allow the next candle to open with a pull back. Then enter long trade close to the broken trend line if the MACD histogram is blue. You can see it in the chart below.
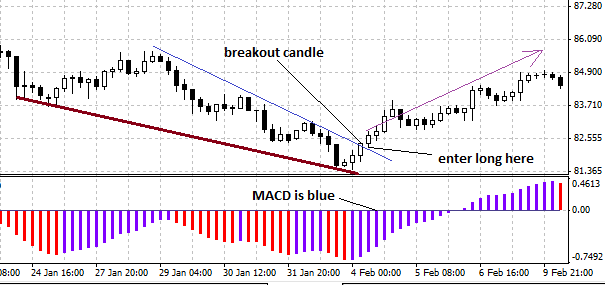
We can clearly see from the 4-hour NZD/JPY chart above that the wedge pattern formed over a period of 10 days. The post-pattern price action lasted for about 5 days and closed to 240 pips.
We see that the price action broke above the upper trend line. On the next candle, the price pulled back to this trend line with the blue MACD, shaping a great entry point for the long trade.
The stop loss is set at a few pips below the broken upper trend line/Take Profit is set at a distance that is at least 3 times the stop loss.
Conclusion
Trading the Wedge/Triangle Breakout Strategy requires proper pattern identification, spotting the breakout and knowing how to set the entries and exits for each trade. Hope you can make a few pips out of this. Try the strategy out in the upcoming Forex competitions. Trading on Demo accounts minimizes the financial risk and allows you to learn how to make short and long trades safely using Wedge/Triangle Breakout Strategy.