The Gartley patterns are another Fibonacci ratios-based strategy that was described by H.M Gartley in 1935. The principles of this pattern can be found in his book published in that year titled “Trading Chaos”.
Gartley patterns can also be described as the XABCD pattern, representing the 5 key points from which lines can be drawn to make the shape of the Gartley pattern. The Gartley patterns have bullish and bearish variations. Test both types in our trading FX competitions on Demo accounts.
However, the locations of each of the 5 points mentioned depend on specific Fibonacci ratios. These Fibonacci ratios are the same ratios that are seen on a Fibonacci Retracement tool: 38.2%, 50%, 61.8%, and 100%.
In addition, some extension ratios such as the 161.8% ratio are also seen. We will now discuss the principles of ratio formation which form the basis of trade entry and exits for this strategy. We now discuss each of the Gartley patterns individually.
Bullish Gartley Pattern in Forex
The Gartley pattern with a bullish outcome resembles an inverted “W”; perhaps even closer to looking like an M.
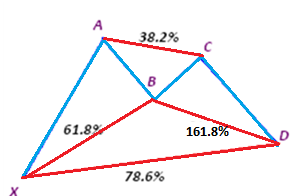
The diagram above is an example of a bullish Gartley pattern. The bullish Gartley pattern is reversal pattern, which is preceded by a downtrend, starts at X and undergoes a series of upward and downward movements which identify the A,B,C and culminates in the D area, from where price reverses upwards.
Pattern Identification
- The preceding pattern is a downtrend.
- The Gartley trace starts at the bottom of the trend at an area marked X, from where price moves upwards to A to form line XA.
- Price then moves downwards to point B, which represents a 61.8% retracement level of line XA.
- Price then moves upwards to C. Point C is at a level representing 38.2%, 50% or 61.8% upward retracement of line AB. Point C is always at a lower horizontal level than A, therefore the retracement can never be 100%.
- Price then moves down to point D. The line CD so formed can be 161.8% extension of BC, or 61.8%/78.6% retracement of line XA. So if you draw your Fibonacci retracement tool from point X to point A, you will expect point D to rest at the 61.8% or 78.6% retracement level.
- From point D, the price action is expected to make a full upside reversal.
With the Fibonacci ratios clearly identifying the entry and exit areas for possible trades, the safest trade that can be setup by the trader is wait for the pattern to complete itself at point D, then initiate a BUY trade at that point.
- Example
For a long trade example, we look to the chart below to give us some guidance.
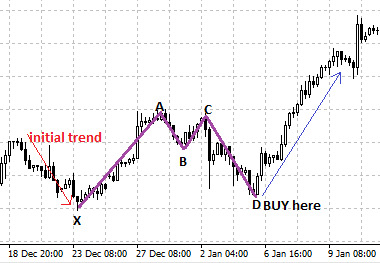
Long trade setup with the bullish Gartley pattern
If you take the Fibonacci trace from point X to point A, the point marked D corresponds to the 78.6% retracement point as we see below:
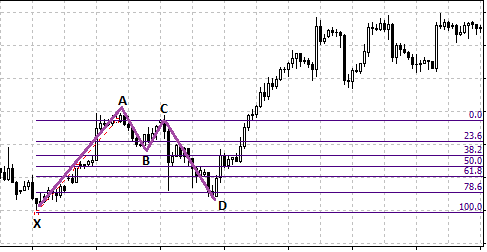
All the trader therefore needs to do is to allow the XABC lines to form, then apply the Fibonacci retracement tool from point X to point A. This gives us where point D will be located, and from there the trader can execute a BUY order to take advantage of the expected bullish move.
Bearish Gartley FX Pattern
The Bearish Gartley pattern forms a characteristic “W” shape when all the ends are joined by trend lines. The diagram below is what the bearish Gartley pattern looks like:
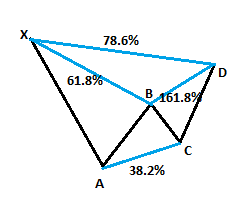
From a starting point X, A, B, C and D are all marked by the Fibonacci ratios as seen in the diagram. The bearish Gartley pattern is also a reversal pattern, though the reversal direction is opposite that of the bullish variety, which is to the downside. The pattern is preceded by a period of sustained downtrend, then kicks off at X and undergoes a series of up-down movements which mark the various points. From the point marked D, price is expected to reverse in a downward trend.
Pattern Identification
- The preceding pattern is an uptrend.
- The Gartley trace starts at the top of the trend at an area marked X, from where price moves downwards to A to form line XA.
- Price then moves upwards to point B, which represents a 61.8% retracement level of line XA.
- Price then moves down once again to C. Point C is at a level representing 38.2%, 50% or 61.8% downward retracement of line AB. Point C is always at a higher horizontal level than A, therefore the retracement can never be 100%.
- Price then moves up to point D. The line CD so formed can be 161.8% extension of BC, or 61.8%/78.6% retracement of line XA. So if you draw your Fibonacci retracement tool from point X to point A, you will expect point D to rest at the 61.8% or 78.6% retracement level.
- From point D, the price action is expected to make a full downside reversal.
The trade option with a bearish Gartley pattern is to allow the pattern to complete itself at point D and then initiate a SELL trade at that point.
- Example
The trade to be demonstrated is how to enter a SELL order at the point marked D, as well as setting the trade exit point. Take a look at the snapshot below:
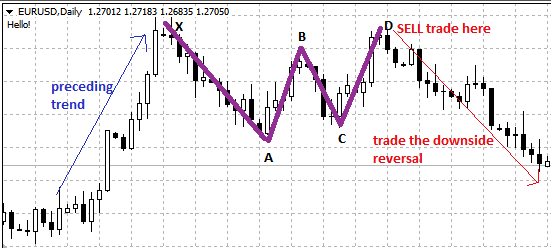
Bearish Gartley Trade Setup
You can see the characteristic “W” shape that is the bearish Gartley pattern. Once the XA and AB lines are formed, the trader can plot the Fibonacci retracement of line XA so as to set the point marked D. Once point D has been identified, look for a technical basis to make an entry. This could be in the form of a candlestick reversal pattern such as a bearish engulfing pattern.
Once a trade has been made, a horizontal line should be drawn across the previous high at point X, and a stop loss set at a few pips above that line. The profit area can then be set at two or three times the number of pips used as the stop loss.
Conclusion
There are now tools that can be used to identify the Gartley patterns on the charts while they are still evolving. With this strategy, you now know how to trade a Gartley pattern when it appears on the charts. Apply the strategy in the next Forex trading competition. Learn how to participate here.