This multiple time frame strategy which is performed with the Parabolic SAR and other indicators is meant to use multiple time frames as a means of sifting the market signals, especially during a period of time when the market is sideways.
Indicators
- Average True Range (ATR)
- Parabolic SAR
- 8-day simple moving average
- 21-day simple moving average
The two moving averages are used for trend determination, with the faster moving average (8SMA) crossing the slower moving average (21SMA) in the direction of the trend and therefore the trade.
Charts Used
This is a multiple time frame strategy which involves the use of several time frames:
- 4-hour chart: used in the analysis of the trend of the asset
- 1 hour chart
- 15-minute chart: This is the chart used to setup the trade entry points.
Ideally, the shorter term moving average (i.e. the 8 SMA) must have crossed the 21 SMA, and both must have been pointing to a particular direction. These are what will point to the trend of the asset. So they should be pointing upwards or downwards. If they are pointing sideways, then the market is going to be flat and you should stay away from the market.
Long Entry
The keystone for entry is that the trend of the asset must be the same on all time frames used for analysis. A long trade setup would be the following, occurring simultaneously on all the time frame charts:
- Price must be above the 8SMA, and the 8SMA must be higher than the 21 SMA.
- Both the 8SMA and 21SMA must be trending upwards.
- The Average True Range must be at the upper limit of the range.
- On the 15-minute chart, the Parabolic SAR is located below the candlesticks.
The entry point is the 8SMA line, when price action has bounced off it without breaking below it. The snapshot below indicates how these signals line up on the 4-hour chart, 1-hour chart and 15-minute chart.
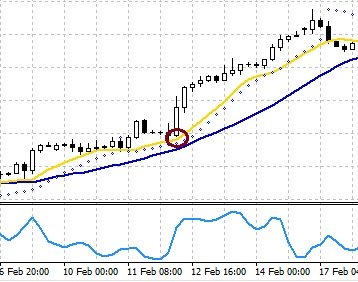
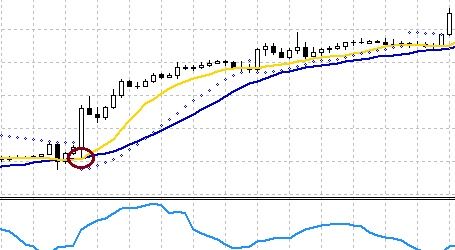
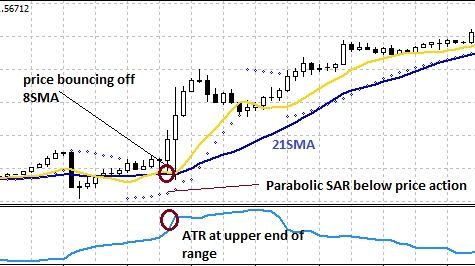
The chart picture says it all. On the 4-hour chart, the moving averages are trending upward with Parabolic SAR showing a bullish bias. On the hourly chart, the same conditions were confirmed. On the 15-minute chart, the Average True Range was at the upper end of range, with price action clearly being seen to bounce off the 8SMA line. This produced the trading signal at that point.
For this trade, the stop loss is not fixed. It must first be set a few pips below the dot on which the trade is setup, and as the price action keeps moving up and dragging the Parabolic SAR with it, the stop loss must continuously be adjusted upwards along with it.
Profits are taken when the Parabolic SAR reverses signal, or when the moving averages start to flatten out.
Short Entry
For the short entry setup, the following rules must be met:
- Price action must be below the 8SMA, which is below the 21SMA.
- Both moving averages must be trending downwards on all time frames assessed simultaneously.
- The Average True Range must be within the lower limit of the range.
- On the 15-minute chart, the Parabolic SAR is above the candlesticks.
The entry point is the 8SMA line, when price action has been resisted at that point (i.e. candlestick cannot break above it). The snapshot below indicates how these signals line up on the 4-hour chart, 1-hour chart and 15-minute chart.
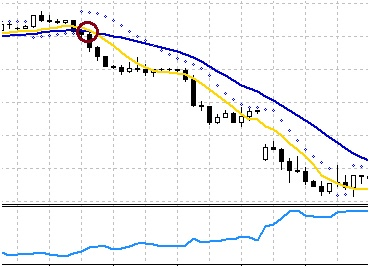
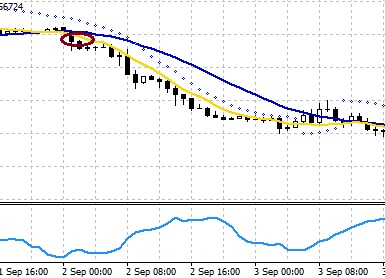
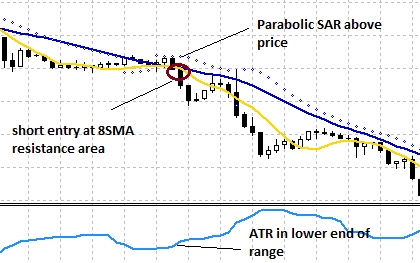
The entry should be made on the 15 minute chart, at the point where the price is resisted at the 8SMA when other conditions have been fulfilled.
For this trade, the stop loss is first at a few pips above the Parabolic SAR dot on which the trade is setup, and as the price action keeps moving downwards, the stop loss is adjusted downwards as well. Profits are taken when the Parabolic SAR reverses signal, or when the moving averages start to flatten out.